3 Explore the Developer Console
Prerequisites
-
You have access to our OpenShift Console: https:///console.chp5-test.npocloud.nl/
-
You have credentials to log in. Please contact NPO Hosting if you don’t have these already.
Introduction
OpenShift 4.x provides a Developer Web Console for anyone trying to deploy and manage applications to the cluster. This GUI is different from Administration Console that is typically used by cluster administrators. Developer Web Console employed by application developers and deployers, application operations, or anyone with an application focus.
Explore
-
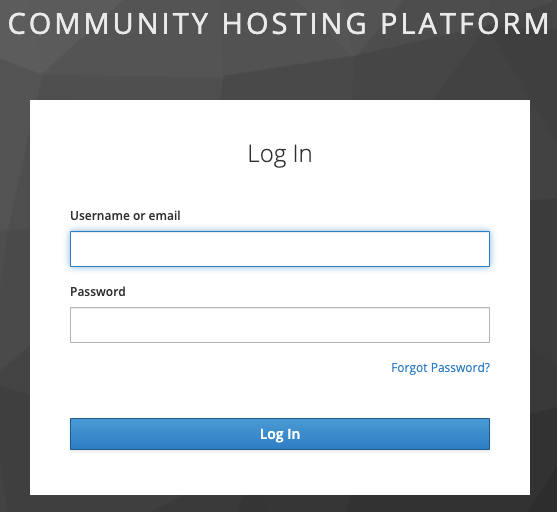
Paste the Web Console URL in the browser. It will ask you to log in.
-
Login with your credentials, i.e.,
usernameandpasswordassigned to you. -
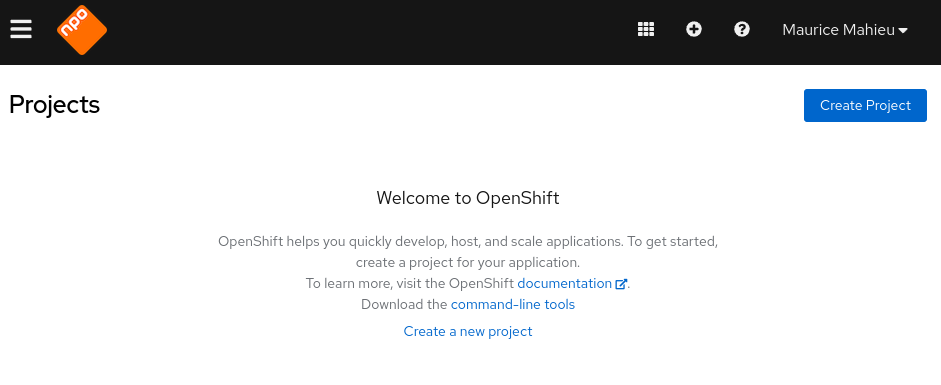
Once you log in, you’ll see a page similar to what shown below. Notice your
usernameon the right top corner. Also, notice the menu bar on the left.
-
Select Create Project button item to create a new project. Name the project based on your
name, e.g.workshop-tim. Project names are unique in a multi-user cluster. -
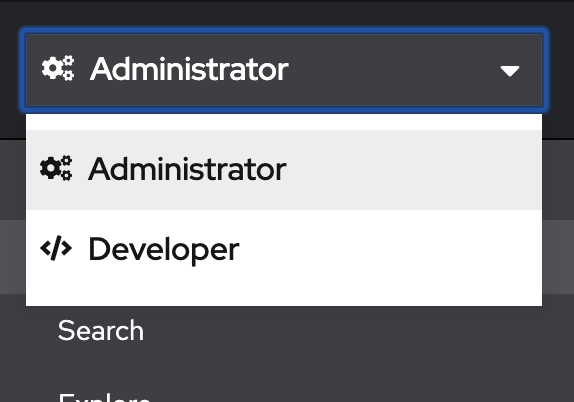
You can now toggle to Developer view by pressing on the
Administratordropdown and selectingDeveloper. In this lab we will focus on Developer view.
-
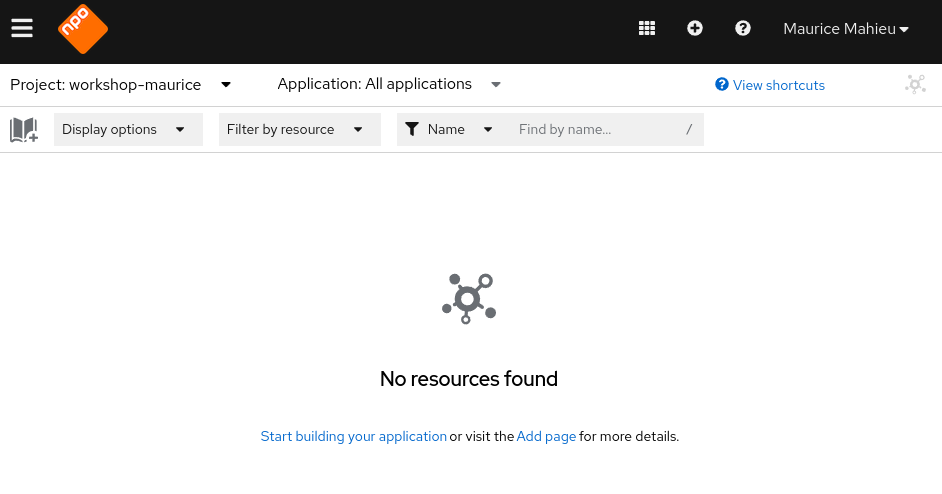
You will now see the developer console. This console has a Menu on the left, and the main area shows different ways to deploy workloads in this project.
-
Take your time and explore menu options.
-
Topology shows the applications deployed. Since we haven’t deployed anything yet, it just shows different ways to deploy workloads in this project.
-
Builds shows the OpenShift build configurations. Once a build configuration created, you can execute, view, and edit build configuration and view build logs.
-
Pipelines take you to the OpenShift pipeline. You can view, edit, and run tekton pipelines. Also, review the related pipeline resources, tasks, and logs.
-
Advanced Section includes a bunch of subsections.
-
Project Details shows the project’s status, inventory of all the objects deployed in this project, utilization of CPU, memory, resource quotas, and events.
-
Project Access allows you to add members and change their permissions.
-
Metrics allow you to query project metrics.
-
Search allows you to search for all the artifacts in this project.
-
Events show a stream of project events.
-
-
Review
In this lab, we logged into the cluster using Web Console and understood the layout and navigation of Developer console which is typically used by the application teams (developers, deployers, and builders)